 This simply shows just how important the Port of New Orleans is in the planet's economy, with a huge amount of shipping routes heading into and out of it. It is involved in the second busiest shipping area in the world, potentially bringing in international cargo or people that are infected with a hazardous disease. Also shown are the other super-ports of the world, of which New Orleans is a part of.
Monday, April 19, 2010
This simply shows just how important the Port of New Orleans is in the planet's economy, with a huge amount of shipping routes heading into and out of it. It is involved in the second busiest shipping area in the world, potentially bringing in international cargo or people that are infected with a hazardous disease. Also shown are the other super-ports of the world, of which New Orleans is a part of.
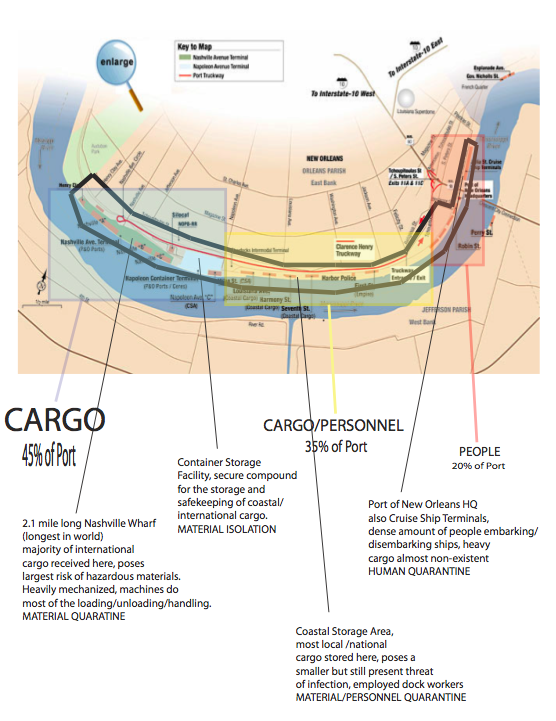 this illustration shows the level of vulnerability of materials and people in the Port of New Orleans, showing how it changes depending on the area that you are in. The left side is almost entire cargo, and it is handled by heavy machinery and mechanized equipment, with very little human interaction. The right side of the Port is almost entirely human oriented, with the majority of the cruise ship terminals here. This illustrates the different precautions and steps that need to be taken to ensure that the right kind of quarantined item (whether cargo or a human) is properly quarantined.
Monday, March 29, 2010

Here is my operative diagram, based on my word, which is change. This illustrates basic spatial conditions as they change in direction, intersection, thickness, proximity to each other, and complexity; i used offset to still maintain a sense of unity throughout the diagram. The goal was to show grossly changing spatial volumes in 40 days, changing every 10 days.
Monday, March 15, 2010


RENEWABLE ENERGY - SOLAR PANELING
Some of the energy needed for my quarantine unit will be provided by the use of multiple solar panel arrays, all aimed to maximize solar potential and generate electricity, as well as hot water as seen in the second diagram. They will be on multiple levels, and on the roof as well as the walls incorporated into the patchwork of glass and opaque panels.
Monday, February 22, 2010


Friday, February 12, 2010

Subscribe to:
Posts (Atom)
